O-Sense

.jpg)


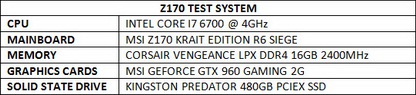
TEST BED
TESTING METHODOLOGY
After over 10 years of testing solid state drives, we’ve concluded that it's almost impossible for any single benchmark suite to accurately measure their performance and that's why in certain benchmark suites we see amazing read/write performance numbers with some drives while in others things are quite different. The reason behind this is that some benchmarking suites are configured to read and write random chunks of data while others read and write constant (sequential) ones. So that's why i always use a very wide selection of benchmarking suites including AIDA64, HD Tach RW, HD Tune Pro, Crystal Disk Mark, Sisoftware Sandra Pro, AS SSD, IOmeter and ATTO. To get the most accurate results each test gets repeated a total of 6 times with the average performance numbers recorded into our charts*. Also, as of February 25th 2015 our results will also include the Storage Networking Industry Association’s (SNIA) IOMeter tests. These tests include a 12 Hour write test used to “simulate” performance degradation over time and a mixed workload test which basically shows what you can expect when using an SSD continuously for roughly two hours. Unfortunately, due to the time required for these tests we repeat them a total of 3 times and not 6 as the above.
Many people have made inquiries about our charts in the past so once again please do keep in mind that the Charts have the average performance numbers of each drive recorded and not the peak (highest) ones. Also, although every single one of these programs can help potential buyers choose the right drive for their needs you should also remember that from any kind of benchmark up to real world usage the gap is not small (and usually most differences will go unnoticed by most people). All tests were performed in a fresh Windows 10 Pro x64 installation with every update installed up to the date of this review.
* Since November 2018 our SSD comparison charts have been divided to 2.5” and M.2 models to reduce their growing size.


.png)