


TESTING METHODOLOGY
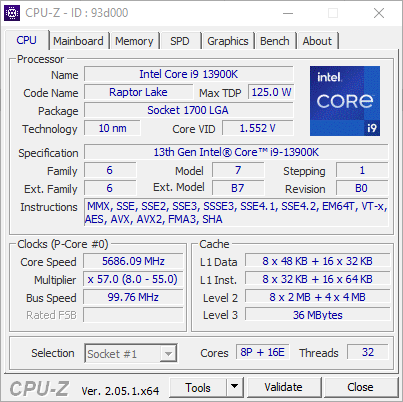
Exactly like used to do in the past each mainboard to arrive in the lab will get mounted on an open-air test bench and will be used for no less than two full weeks (daily tasks and gaming) with a fresh Windows 10 Pro installation. All motherboards arriving here will be tested with the top CPU of that line available to me at the time of each review (I9-9900K for Z390/I9-10900K for Z490/I9-11900K for Z590/I9-12900K for the Z690/Ryzen 9 5900X for X570 and B550/7900X for X670E and B650E/13900K for Z790) together with 16GB (2x8GB) DDR4 4GHz RAM for the Z390/Z490 motherboards, 32GB (2x16GB) DDR4 4GHz RAM for the Z590 and X570S/B550, 32GB (2x16GB) DDR5 6GHz for X670E and 32GB (2x16GB) DDR5 6.4GHz RAM for Z690/Z790 motherboards. Now I don’t know if I will need to change this anytime soon but for now the Intel I9-9900K, I9-10900K and I9-11900K CPUs in each review will be set at 5000MHZ (CPU ratio set to 50 - of course voltages may vary slightly from motherboard to motherboard - RING/Cache frequency at 4700MHZ), the Intel I9-12900K CPU at 5.2GHz (3.7GHz for the E-Cores / RING ratio set at 43), the AMD Ryzen 9 5900X CPU at 4500MHz, the AMD Ryzen 9 7900X CPU at 5.4GHz and the Intel Core I9-13900K CPU at 5.8GHz (4.7GHz E-Cores / RING ratio set at 49).
I did think about pushing each motherboard to the max to see which is the better overclocker but 5.2/5/4.5/5.4/5.8GHZ 24/7 is more than plenty today, not only in terms of performance but also temperatures (not to mention there are colleagues of mine who have been focusing on maximum overclock potential so that’s also out there). Instead i decided that it'd be far more interesting (not to mention accurate) to see which motherboard is the fastest when using the same exact hardware components/configuration (CPU/RAM/COOLER) with the same exact overclocking frequencies */**. To figure that out I’ll be using several benchmarking programs (6 repeats after which the average numbers will get recorded in the charts) like AIDA64, CINEBENCH R20, CPUZ, Passmark Performance Test, RealBench and the Sisoftware Sandra Titanium 2020 version. Needless to say, that between different system configurations these charts also do a great job pointing out the difference in CPU performance.
* Charts will contain other system configurations as well in order to better showcase the performance of each reviewed system.
** Surpassing 4.7GHz with the Ryzen 9 5900X on all cores proved impossible so I chose 4.5GHz as the most balanced choice for all my tests (besides, the latest Intel CPUs in the charts could also climb higher than 5GHz on all cores).