O-Sense


Page 10 of 11
TEST RESULTS – IOMETER SNIA
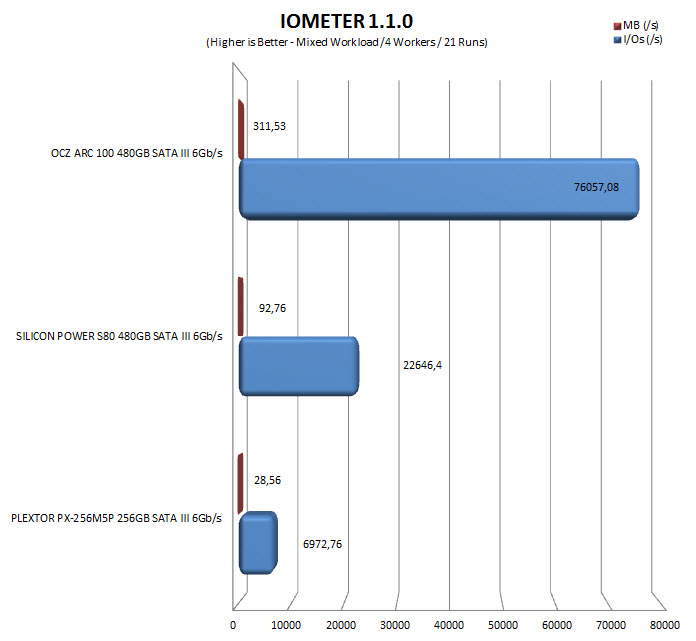
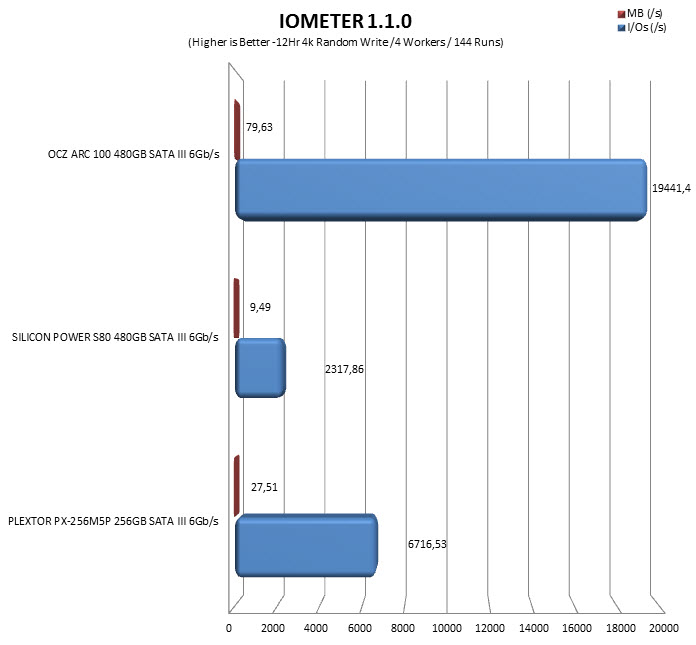
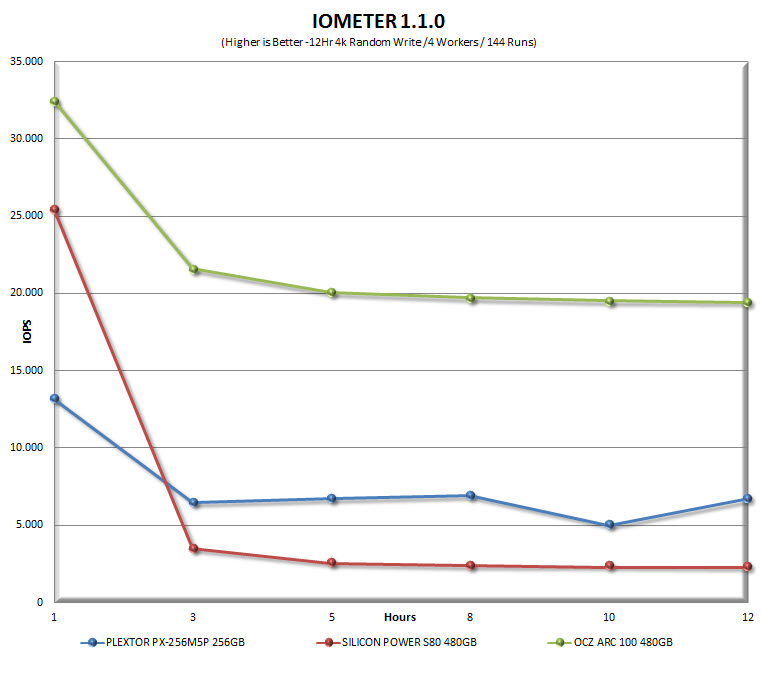
As you can see we used an extra graph to showcase the decline in write performance during a 12 hour period between the three drives we performed the SNIA tests with. Of course more drives will be added onto the charts and graph in time but for now we wanted you all to get a better understanding of these tests and having the ARC 100 alone wouldn't show much.