O-Sense


What’s New: Intel today announced the release of Continuous Profiler to open source -- serving as an example of the company’s open ecosystem approach to catalyze innovation and boost productivity for developers. The optimization agent is actively used by companies including ironSource, ShareChat and Snap Inc. to identify production bottlenecks and optimization opportunities. Developed by Intel® Granulate™ and contributed to the open source community, Continuous Profiler is a solution that combines multiple profilers into one view as a flame graph. This unified view offers developers, performance engineers and DevOps a continuous and autonomous way to identify runtime inefficiencies.
“Continuous Profiler has been at the heart of what we’ve been doing at Intel Granulate. By helping developers identify bottlenecks in the code, businesses can optimize their applications more easily and effectively.”
Why It Matters: Determining why central processing units (CPUs) are busy is a routine task for performance analysis in any testing and production environment. Continuous Profiler delivers a flame graph of the hottest code paths.
“This visualized view makes it immediately obvious where CPU is consumed so you can find cost savings, eliminate bottlenecks, improve throughput, and reduce latency and performance regressions,” said Brendan Gregg, Intel Fellow. “In today's complex environment, however, flame graphs can unearth so many performance wins that it becomes laborious to apply them all. Intel Granulate automates this task, allowing companies to realize these performance wins now and in the future as Intel develops more optimizations.”
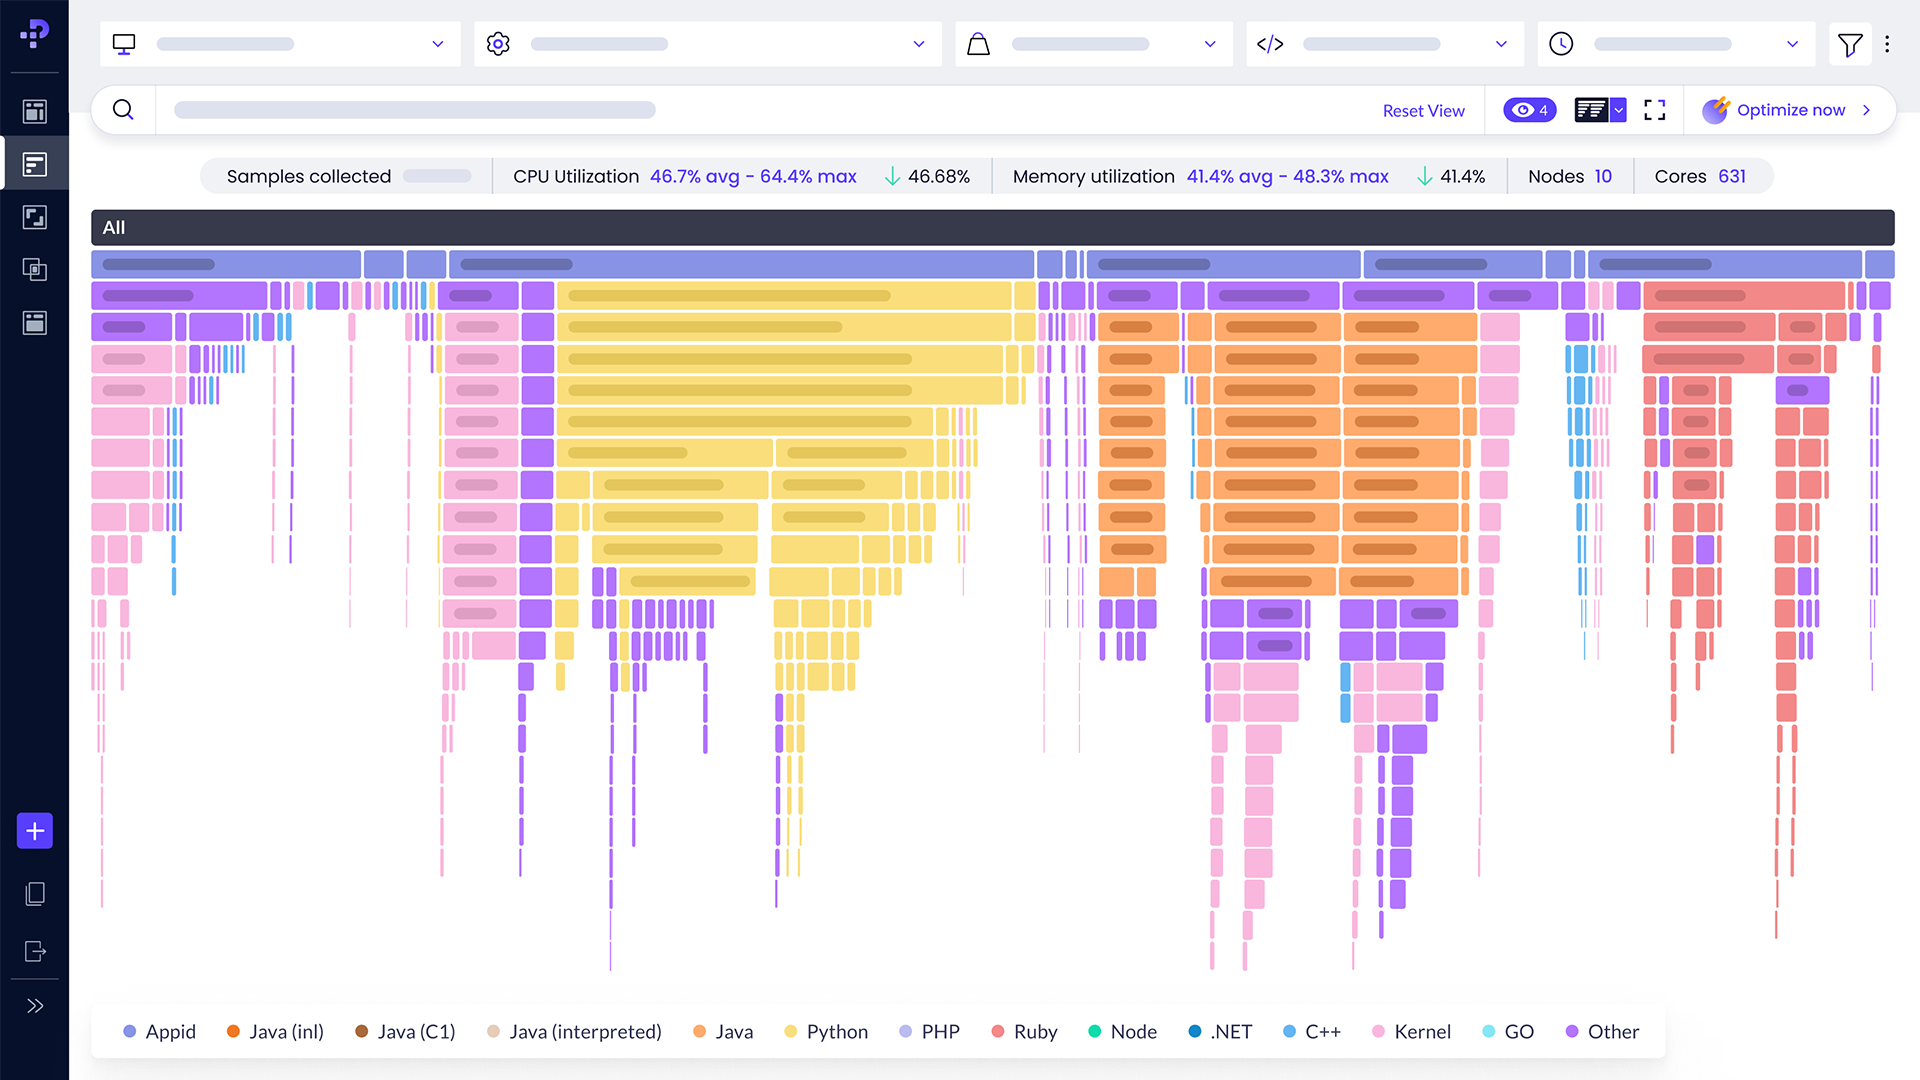
How It Works: The evolution of gProfiler, Continuous Profiler combines multiple sampling profilers to produce a unified visualization of what a CPU is spending time on. Easy-to-navigate flame graphs pinpoint performance regressions, such as garbage collection, deadlocks and others to help smooth deployments.
Among its unique features, Continuous Profiler allows DevOps to filter services based on container name, hostname or Kubernetes deployment object by simply selecting the resolution level within the platform. These native Kubernetes filters profile down from the deployment to pod level without having to deploy a profiler for each object. This allows teams to investigate the behavior of different deployments, pods, nodes and hosts across different regions and code.
The profiler is compatible with Intel Granulate’s continuous optimization services and can be deployed cluster-wide within minutes, supporting a range of programming languages without requiring code changes.
Continuous Profiler is SOC2-certified and held to Intel's high security standards, ensuring reliability and trust in its deployment.
What’s Next: With a simple user interface (UI) and seamless integration, Continuous Profiler will add modifications to meet unique developer needs, uncover bottlenecks on the runtime level and boost application performance for improved user experiences.
Together with open source contributors and the broader ecosystem, Intel will further refine the tool and help developers make applications faster, stronger and more cost-efficient.
About Intel at KubeCon EU: At KubeCon EU, Intel will have two booths. Being a part of the open source community means being an active contributor and Intel is active with over 100+ open internal projects, contributing to 300+ open source projects, and belonging to 700 foundations. Learn more at the Intel Open Ecosystem Booth #H5. Check out the Intel Enterprise Software Booth #J17 to see how Intel solutions help companies manage, secure and scale cloud-native workloads more efficiently and confidently – paving a faster way to AI.